
Curbing Russian oil and gas revenues: next steps
08 August 2022
Jacob Nell, Nataliia Shapoval (Kyiv School of Economics) and Borys Dodonov (Kyiv School of Economics)
03.05.2022
Strong Russian oil and gas revenues have supported reserves and stabilised the ruble during the war. Reducing those revenues rapidly would erode reserves, put the ruble under renewed pressure and weaken Russia’s capacity to wage war.
When the war started, Russia seemed to have an impregnable reserve position, with $643 bn, or a huge 22 months of import cover, as well as a flexible currency, helping adjustment to any shock. But the imposition of full sanctions on the Russian central bank at the start of the war exposed a vulnerability. It halved Russia’s FX reserves, freezing just over $300 bn in reserves. And it cut available FX by more than this implies, since £132 bn (21%) of Russia’s reserves are held in gold, as of the most recent Jan-22 reporting date and another substantial portion is held in yuan (13% in mid-2021, which would amount to about $84 bn), which are not freely convertible at scale into FX. This implies that FX available to the CBR might have been just under $130 bn as the war started, and then fell nearly $40 bn in the first month after the invasion.
This is danger territory for Russia, where under sanctions, the CBR is the backstop provider of FX, and has a limited supply, far less than the potential demand. On one standard metric given average 2021 monthly imports of $31.6 bn, at the trough Russian FX reserves might have covered just under the three months import cover typically seen as required for comfort. But this understates the potential pressure: Russia’s banks have foreign liabilities of $130 bn, and one quarter of all domestic Russian bank deposits, about $200 bn, are in foreign currency. Absent capital controls, many of these liabilities are likely to run, and can only be settled with access to the CBR’s FX holdings. Even more basically, Russia has a recent history of runs on the ruble when the population seeks to turn their rubles – the main liability of the central bank – into FX during crises, typically marked by falling or weak oil revenues, including repeatedly in the early to mid-1990s, and in 1998, 2008 and 2014.
However, the strong inflow of oil and gas revenues since the start of the war – which the Kyiv School of Economics has calculated, as set out in more detail in the Annex, at $53 bn from EU buyers alone, or an average of $801 mn per day in the 66 days of the war to end April, has stabilised the economy. The inflow has supported a recovery in reserves, a return of the RUB to pre-war parity, and allowed the Russian authorities to ease policy, cutting interest rates in two steps from 20% to 14%, and modestly easing capital controls.
Reducing these inflows would put the RUB back under pressure, and pose a dilemma to Russian economic policymakers: either they tighten policy – raising interest rates, and avoiding additional budget spending – to support the RUB, which will hit the economy and hamper the war effort. Or they ignore the risk to the RUB and keep spending – but then risk a return to entrenched high inflation, which will also undermine the economy.
Over time the global economy can manage the loss of 5 million barrels a day of Russian oil supply without major disruption – just as it managed the previous loss of 5 million barrels a day of Russian production after the breakup of the Soviet Union. Similarly, replacing Russian gas supply to Europe looks manageable over time, with many substitutes for gas in power and multiple alternative sources of gas. The hard question is how much can be done right now to curb Russian oil and gas revenues rapidly – bearing in mind the risk that an immediate Russian oil and gas embargo in a tight market could drive higher prices and shortages, squeezing disposable incomes and pushing economies into recession.
We look at gas first. Historically gas has been a relatively unimportant part of Russian oil and gas revenues, and even in 2021, despite high gas prices, gas accounted for just 26% ($63 bn) of Russia’s $244 bn in oil and gas exports. But record high prices and strong European demand has changed the picture: the Kyiv School of Economics now calculate that European buyers have paid more for gas since the war started (an average of $471 mn per day) than they have for oil (an average of $332 mn per day), although in April revenues from oil and gas have been more equal.
Our view is that Europe does not need Russian gas in aggregate until next winter, it does not need so much Russian gas – the EU estimates one third of last year’s volumes (155 bcm) provided countries makes full use of all policy options for reducing their dependence on Russian gas. Meanwhile, Russia is heavily reliant on its gas revenues and will struggle to sell its gas elsewhere, lacking pipelines and liquefaction capacity – and if it does manage to find a market, it would likely have to accept a much lower price, as it does in China, where the Russian gas selling price is as much as ten times lower than European prices.
In particular, given the need to maximise pressure on Russian now, we suggest:
• a temporary moratorium on all purchases of Russian gas by EU member states until the European Council in June, to squeeze Russian gas revenues now during the war in Donbass;
• a single sales channel through Ukraine, i.e. a requirement that Russian gas be delivered to EU markets exclusively by the Ukrainian GTS. As a corollary, Nord Stream 1 and Yamal – built to avoid Ukraine as part of Russia’s aggressive plan to undermine Ukraine – should not flow gas again;
• Ukraine levy an additional Ukrainian peace and reconstruction levy on all gas transiting Ukraine, which should materially reduce Russian gas revenues;
• iv to reduce the target level of gas storage in Europe to 70% from the current 80% by November 1, to reduce European demand for Russian gas this year.
While not proposing to end all EU purchases of Russian gas this year, to allow time for a smoother adjustment to a deRussified European gas supply, Russia may act first to cut off gas supplies to Europe, as it already has to Poland and Bulgaria over their refusal to pay for gas in rubles. So Europe also needs to prepare for a winter without Russian gas, encourage maximum use of substitutes for gas, maximum sourcing of alternative sources of gas supply, and act to curb demand for gas.
On oil, Russian crude and product exports liable to direct sanctions – those going to EU/OECD – amount to nearly 5 million barrels of oil a day. With a tight market, taking a substantial chunk of this production off the market in February looked likely to drive a price spike. However, 2022 demand growth is turning out weaker than expected, helped by Chinese Covid lockdowns, giving scope to accommodate some fall in Russian production, with Russian production already down by nearly 1 million barrels a day by late April, and oil prices holding around pre-invasion levels. Secondly, Russian oil is now trading at a deep discount – currently around $30/35 bbl – given the reduced numbers of buyers and increased sanctions risk, hitting oil revenues. Now, we propose two further steps.
First, an immediate full EU embargo on Russian oil products, with a possible phasing of the embargo on diesel. Largely because of tax benefits, Russia exports a high proportion – around 30% – of its oil exports to Europe in the form of refined products. If the European market closes, it will be harder to find a market for this product than for crude, given more specialised storage and logistics, with excess inventory likely to drive either refinery and production shutdowns or a deep discount on sales, or both. Meanwhile, European refineries have some spare capacity – with capacity utilisation running around 85% in recent years, and spare capacity of about 3 mn barrels of oil per day i.e. around twice the volume of Russian oil product exports to Europe. In aggregate, European refineries should be able to buy more crude, increase runs and cover the gap.
Second, a full EU embargo on all Russian crude sales by year end should deliver further production shut-ins and a deepening of the discount on sales to Asia. Here, we see a balancing act. If the market becomes looser and the oil price falls, additional pressure can be put on other countries not to buy Russian oil, tightening the embargo, reducing Russian production further and deepening the discount. But if the oil price starts to rise, then Ukraine’s allies should be temporarily tolerant of the redirection of Russian crude sales at a discount to Asia, hitting Russian oil revenues while maintaining oil supply – while of course maintaining a discount-inducing threat to clamp down on Russian sales to other countries.
These measures – notably a moratorium on EU purchases of Russian gas, followed by a single channel of sales to the EU via the GTS with an additional Ukrainian levy on Russian gas, combined with aggressive action to reduce demand for Russian gas, as well as an immediate ban on EU purchases of oil products – would reduce Russia’s oil and gas revenues significantly. In particular the moratorium on gas sales would reduce gas revenues by $10-$15 bn per month in the near term, while the loss of a further 2 million barrels of oil exports – or the loss of 1 million barrels and a $10/bbl deepening of the Russian oil discount – would reduce revenues by a further £5 bn per month. This would put Russia’s international reserves, which have been rising at a monthly pace of nearly $10 bn, firmly back on a downward path, and the RUB and Russian economy back under pressure, especially given the impact of the broader sanctions on trade, as recently highlighted by CBR governor Nabiullina, and against the perspective of Russia’s complete loss of its European markets for oil and gas.
Annex: EU dependence on and post-invasion payments for Russian oil and gas
Dependence on Russian oil and gas is calculated using IEA data. The IEA provides data only in percentage terms, so to get data in physical units, the supply of oil and gas for each EU country was taken from the IEA website and multiplied by the dependence on Russian fuel.
Table 1. EU member state reliance on Russian oil and gas in 2020
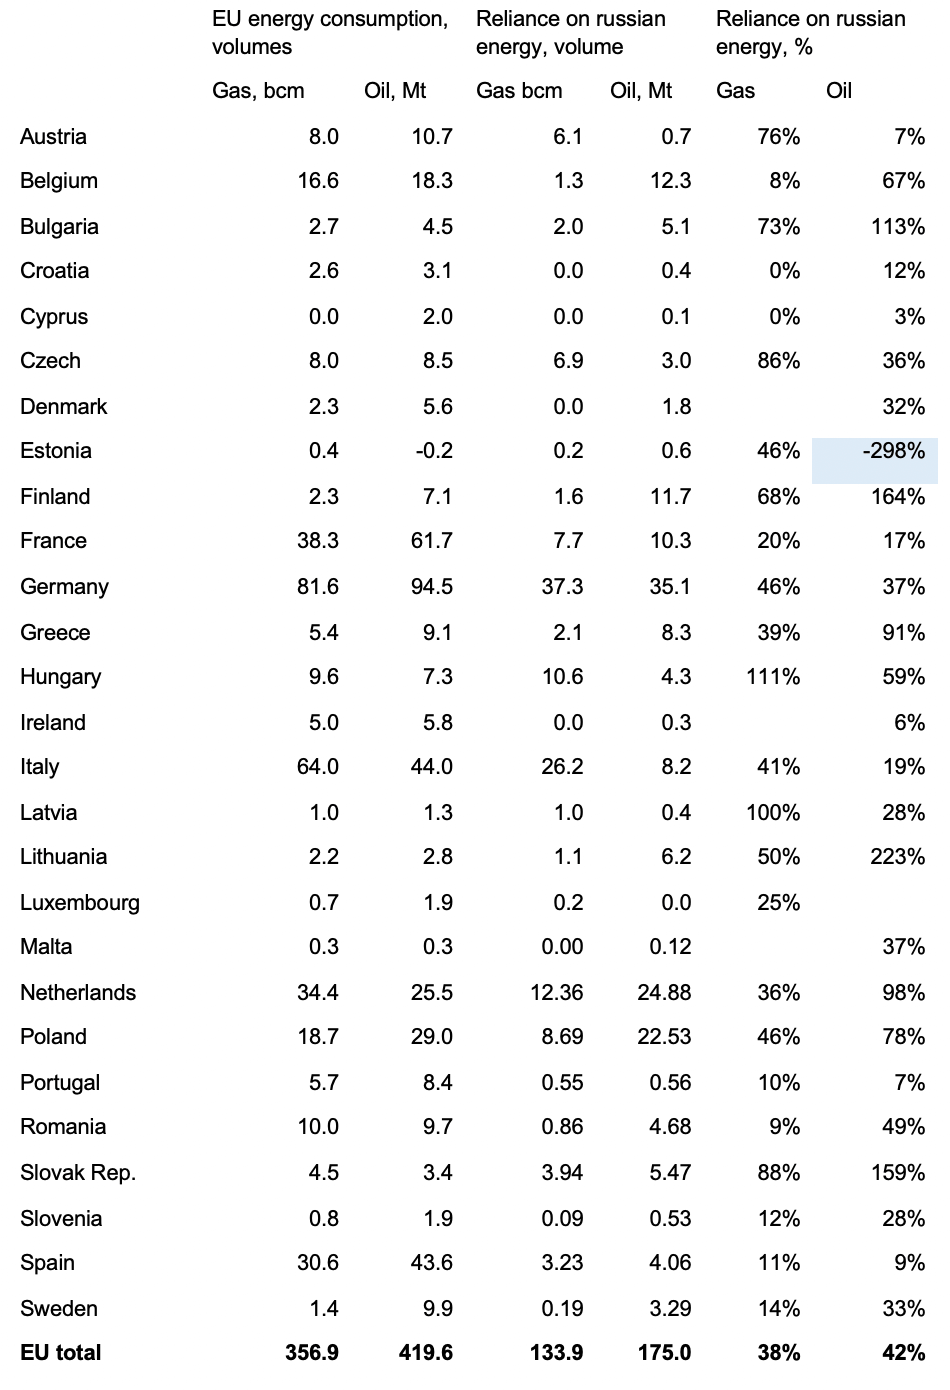
The most recent available data is for 2020. However, these are only an approximate guide to current reliance for two reasons. First, 2020 consumption was heavily affected by COVID 19, so extrapolation to 2021/22 underestimates total payments for Russian energy. Second, Poland and Lithuania have started receiving LNG deliveries, cutting their reliance on Russian gas.
Estimated post-invasion oil imports from Russia, by EU member state
In order to estimate the payments for Russian oil by country, we assumed the average daily volume of Russian oil imported by country in November 2021 (most recent data) and then multiplied by market prices, assuming a discount of $30/bbl to Brent for the last two weeks of April.
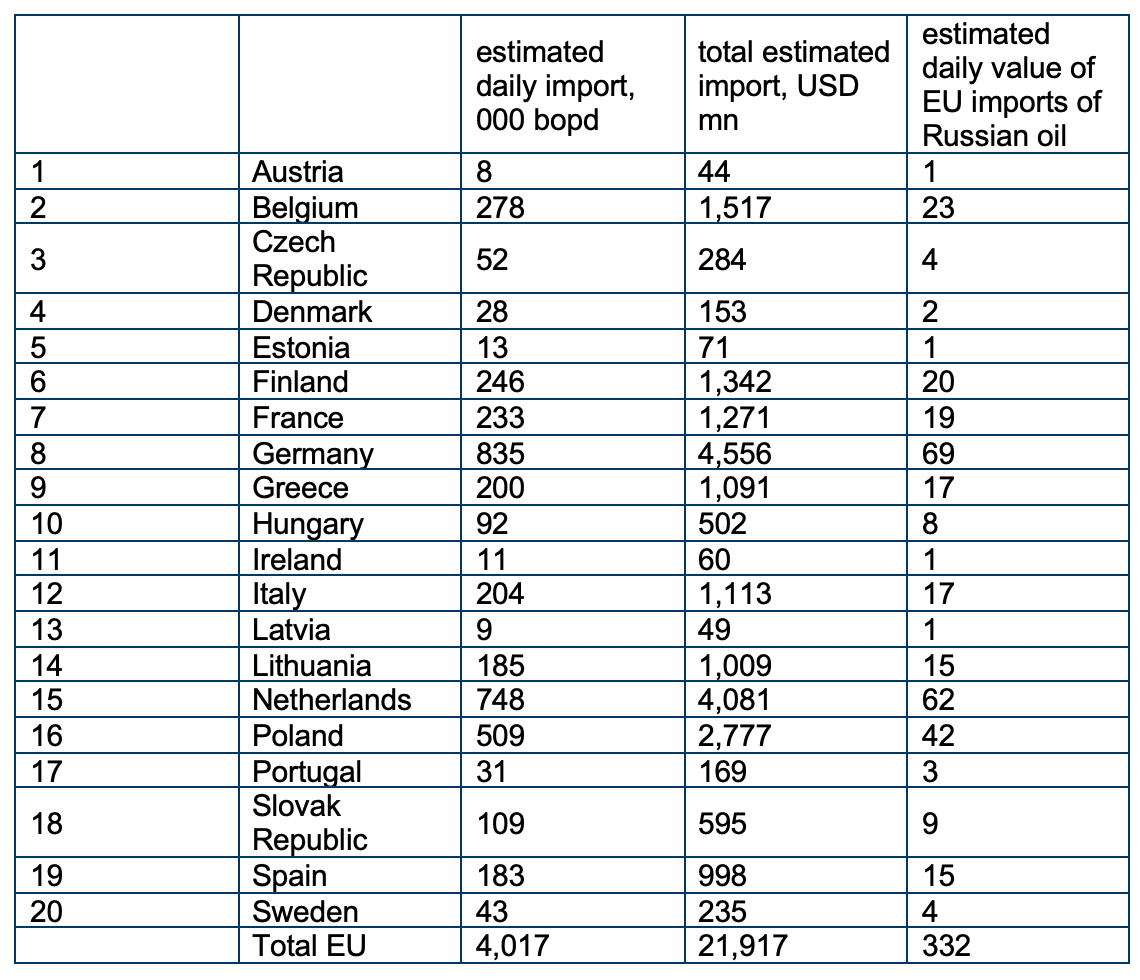
To calculate the daily payments since the invasion we took average monthly prices of Brent crude from the World Bank in February and March and applied the average monthly discounts for Urals blend. For April 1-30 2022 the discount is assumed to be equal to USD 30/barrel.
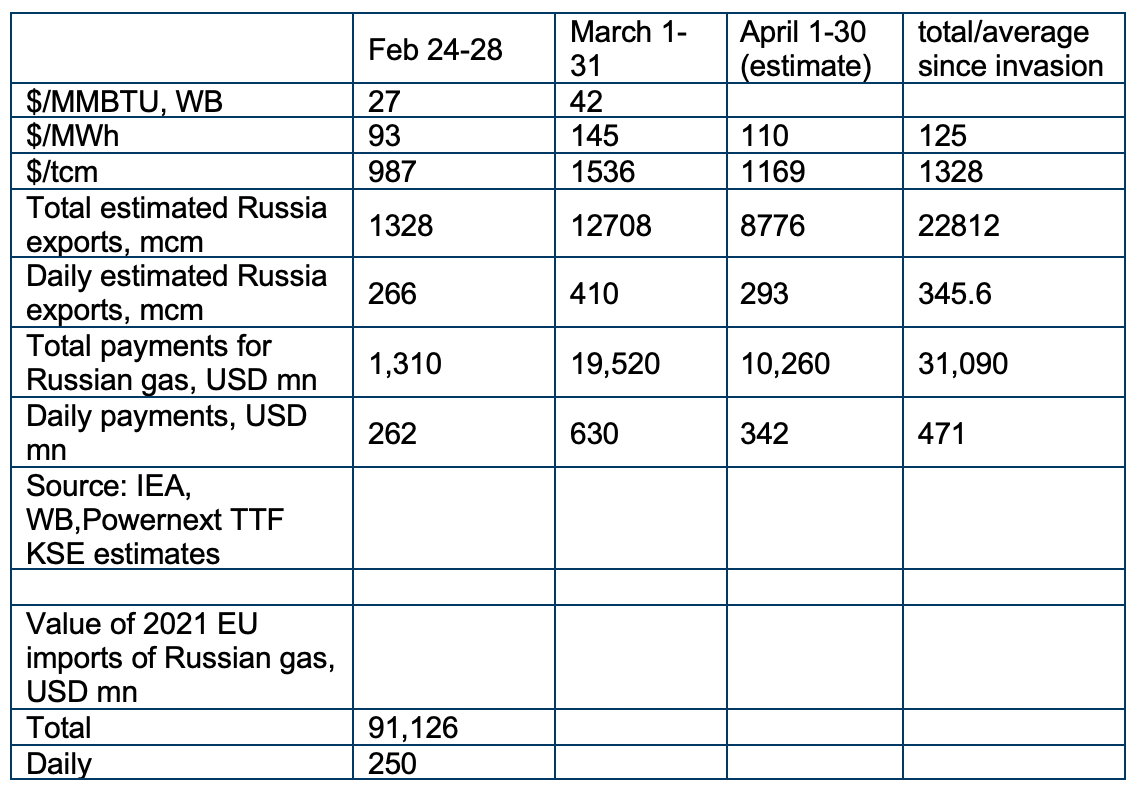
Estimated post-invasion payments for Russian gas
To estimate the EU’s payments for Russian gas since the invasion we obtained the dataset containing weekly imports of Russian gas to the EU (McWilliams, B., G. Sgaravatti, G. Zachmann (2021) ‘European natural gas imports’, Bruegel Datasets, first published 29 October, https://www.bruegel.org/publications/datasets/european-natural-gas-imports/).
The average monthly prices for February and March at the most liquid European hub (Title Transfer Facility or TTF) were taken from the World Bank. The price for April 1-17 is a simple average of April 1-14 at TTF at the EEX platform https://www.powernext.com/futures-market-data.
The volume and price for 2021 was taken from the IEA quarter 1 report.
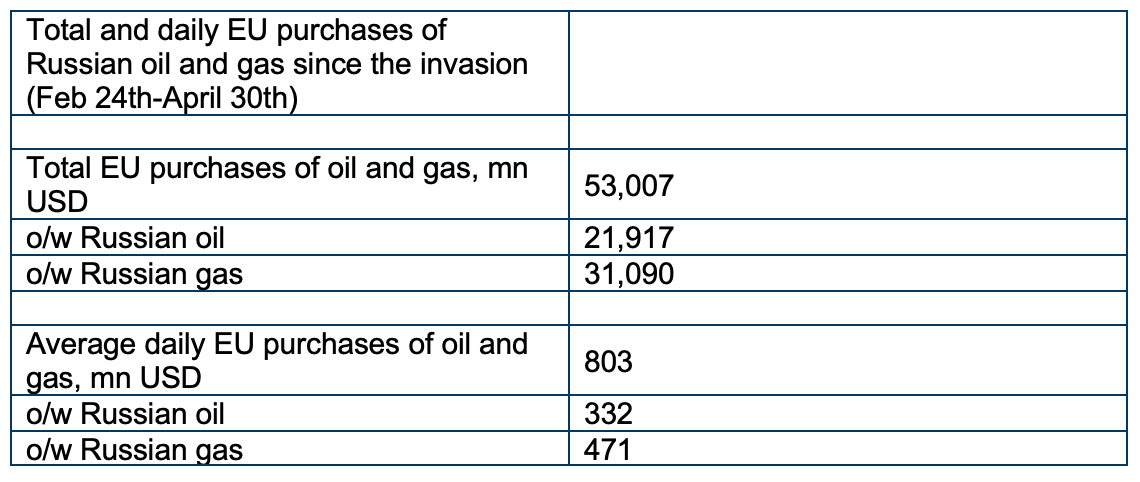
Summary: Total and daily EU payments for Russian oil and gas since Russia’s invasion
The total EU payments for Russian oil and gas is the sum of the estimated oil and gas estimates described above. The average daily figure is the total divided by the 66 days of invasion.
Source: IEA, WB, KSE estimates
The total figure is lower than the 1 bn per day cited by Joseph Borrell on April 6.
We assume that Borrell’s estimate is based on average 2021 daily imports from Russia. We would get a very similar estimate based on such approximation. However, the volume of natural gas imports from Russia declined in 1Q22, perhaps reflecting Gazprom’s policy of withholding supplies from Europe, with a view to maintaining high prices and increasing Russia’s leverage over Europe.